
Retirement savers between the ages of 60 and 63 now have an additional option for catching up.
Amy C. Arnott, CFA Jan 13, 2025
Since 2002, retirement savers who are age 50 or older have been able to contribute additional amounts to retirement plans, such as 401(k)s, 403(b)s, and 457(b)s. For 2025, employees under the age of 50 can contribute up to $23,500 per year to these types of tax-deferred retirement plans, up from $23,000 in 2024. Participants who are age 50 or older can contribute an additional $7,500 per year in “catch up” contributions, raising the total contribution limit (not including any employer contributions) to $31,000 per year. These higher limits can help savers make significant progress toward shoring up retirement savings.
Thanks to a provision included in the Secure 2.0 legislation, retirement savers between the ages of 60 and 63 can contribute a bit more with “super catch–up” contributions starting in 2025. For people in that age range, the annual catch-up contribution limit is now $11,250. That means people can save a little extra over a four-year period (provided that their specific retirement plan offers both catch-up and super catch-up contributions).
It sounds good in theory, but how does it work in practice? In this article, I’ll run some numbers to see how much of a difference turbocharging retirement savings after age 60 can make.
Running the Numbers
In the examples below, I’ll start with a hypothetical investor at age 50 with a $70,000 annual salary, with earnings increasing by 2% per year. I’ve also assumed starting retirement savings of $60,000 (in line with the median 401(k) balance for investors between ages 45 and 54 based on Vanguard’s How America Saves report) and estimated returns of 6% per year. Note: the numbers below don’t include any potential employer contributions, which would help shore up the totals. Nor did I assume any increase in the annual contribution limits for inflation, which would also make things look better.
Case 1: 10% annual savings rate
The first series of data assumes an investor who is able to save 10% of their salary starting at age 50. The orange bars in the graph below show the estimated portfolio value after the worker maintains the same savings rate year after year. The numbers assume the employee saves 10% of salary up until age 60, then ramps up annual savings to $34,750 from age 60 to 63, and then continues to max out savings by contributing $31,000 per year for the last four years until retiring at age 67.
Even after diligently chipping in 10% per year, the consistent saver (shown in the orange bars below) would end up with a pretty sparsely twigged nest egg. The estimated portfolio balance would be about $416,000, which is less than half of what they might need (roughly $980,000) based on a target level (which I think is reasonable after testing some data) of about 10 times one’s final salary in retirement savings.
Projected Retirement Balance: Case 1
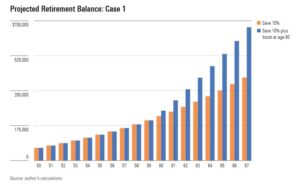
Things look better with the savings boost. The estimated ending balance would be about $668,000, which is still lower than what you might want, but closer to the 10 times target. (To be fair, much of the improvement owes to my assumption that the hypothetical investor continued to max out savings after the four-year “super catch-up period.”)
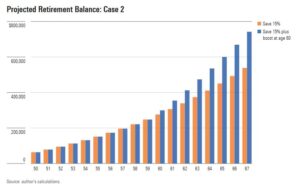
Case 2: 15% annual savings rate
I used similar assumptions for the second set of data but boosted the annual savings rate to 15% of salary beginning at age 50. The orange bars show the estimated totals assuming a consistent savings rate each year, while the blue bars assume that annual savings ramp up to $34,750 from age 60 to 63 and then continue to max out at $31,000 per year through age 67. Both totals are still well shy of target levels, albeit a bit closer to where you might want to be.
Projected Retirement Balance: Case 2
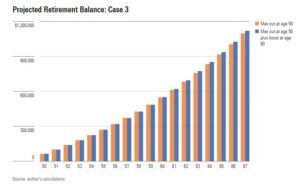
Case 3: Max out savings at $31,000 per year starting at age 50
In this case, I assumed that our hypothetical saver started maxing out retirement savings at age 50. The orange bars show the estimated totals assuming a flat contribution rate of $31,000 per year from age 50 until retirement, while the blue bars assume contributions of $31,000 per year from ages 50 through 59, ramping up to $34,750 from ages 60 through 63 and then returning to $31,000 per year through age 67. In both cases, the ending balance would be large enough to fund a reasonable level of spending during retirement, but the numbers on the right end up with a slightly higher balance (about $1,120,000 versus $1,098,000).
Projected Retirement Balance: Case 3
Conclusion
As a general guideline, the projections above illustrate the benefits of starting early, as well as the potential boost from more-generous contribution limits. Retirement savers who are running behind (Fidelity’s age-based target of retirement savings worth 6 times your annual salary by age 50 is a good way to gauge this) can make significant progress toward narrowing the gap by maxing out savings starting at age 50. Taking advantage of the new “super catch-up” contributions over a four-year period won’t make a huge difference in and of itself but is probably a good idea for investors who can afford it.
© Copyright 2025 Morningstar, Inc. All rights reserved. Dow Jones Industrial Average, S&P 500, Nasdaq, and Morningstar Index (Market Barometer) quotes are real-time.
The accompanying pages have been developed by an independent third party. Commonwealth Financial Network® is not responsible for their content and does not guarantee their accuracy or completeness, and they should not be relied upon as such. These materials are general in nature and do not address your specific situation. For your specific investment needs, please discuss your individual circumstances with your representative. Commonwealth does not provide tax or legal advice, and nothing in the accompanying pages should be construed as specific tax or legal advice. Securities and advisory services offered through Commonwealth Financial Network®, Member FINRA/SIPC, a Registered Investment Adviser. Fixed insurance products and services offered through Axial Financial Group are separate and unrelated to Commonwealth.
Axial Financial Group. All Rights reserved. 1 Van de Graaff Drive, Suite 500, Burlington, Massachusetts. 781.273.1400